Part Five – Back to Where It All Started
[The entire report can be downloaded as PDF, flood_years-r0-20241201.pdf]
[The start: https://www.scienceisjunk.com/the-100-year-flood-a-skeptical-inquiry-part-1/]
Some weeks ago, this author began looking into how weather history relates to “100-year flood” numbers that are used in many contexts. It was supposed to be a short study with a quick bit of math to show how history may not give good extrapolations very easily. It has been a lot more work than that – because this is hard!
Shopping for Numbers in Asheville, NC
At the end of September, 2024, hurricane Helene pushed up from the Gulf of Mexico right into the southern Appalachian Mountains. Many roads and parts of towns were washed out. The southern part of Asheville, NC was put under ten feet of water. What caused this was a multi-day rain event which started with an all-day soak and then two days of heavier rain, as seen in this data from the Asheville airport, a bit south of town.

By our two-day max pair method, the high value out of this storm is 9.89. We could reasonably add in the 4.09 for a total of 13.98 inches of rain.
Taking data from a nearby airport, back to 1973, we go through the same old procedure. At the high end of the annual maxes there is a cluster of years near the same value, about 5.25 inches. In 52 years, there are no events within 60% of the 9.89” observed in September, 2024.
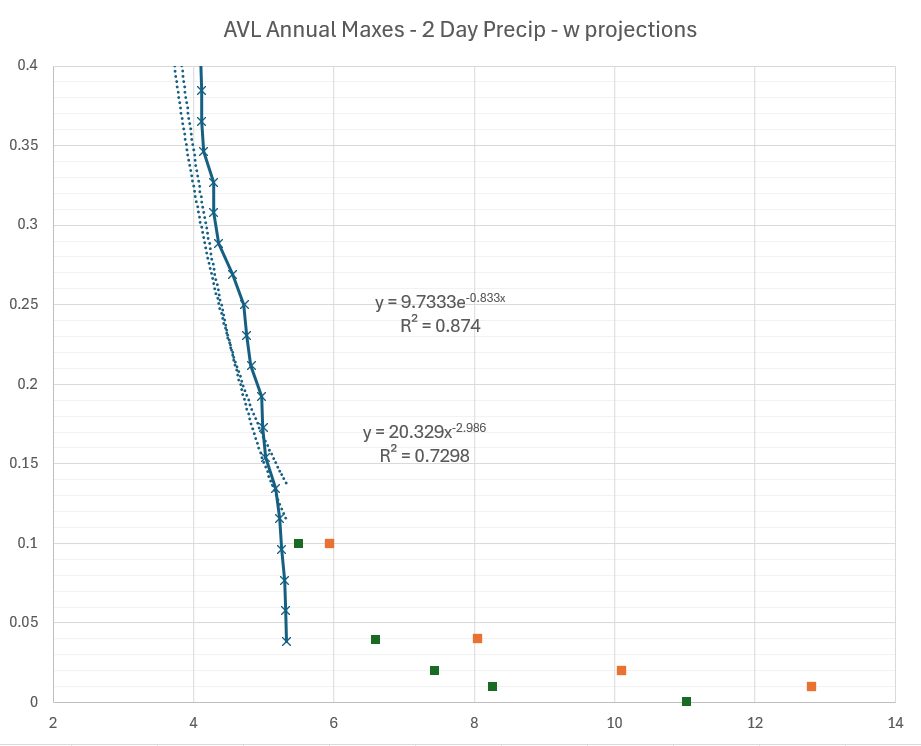
For this graph we’ve zoomed in some to see the details. The exponential fit gives a 100-year event of 8.25 inches, the power-law fit 12.8 inches of rain. The exact numbers are debatable (as we have well shown), but probably the basin around Asheville should expect rain as heavy as was recently seen more often than once in a lifetime.
Transmogrifying to Flood Levels
This extends to actual flooding, of course. The Swannanoa River hit a new record of 26.1 feet above nominal level. It’s time we investigated the leap from rain amount to flood level. We’re not going to do this deterministically, but some of the problems with that are noted next.
The first matter is the total basin area collecting water. At this point most of the USA is well mapped and encoded in databases like behind the USGS “Streamer” web site. All rivers upstream of the gage point are highlighted in red. The location of the AVL airport is marked with a star.

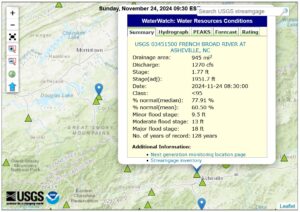
We noted before that flooding results from rain are time dependent. On top of simple upstream area, we would need some idea of the permeability of all the ground to estimate if it may be already saturated.
The point marked on the preceding map is the location of a stream gage on the French Broad River on its way out of Asheville. A simple gage can give flow speed at one point in the water. Another might give height of the water over some reference. With those two values in hand, we still need to know the shape of the river bed to calculate anything. Those shapes can vary a lot.
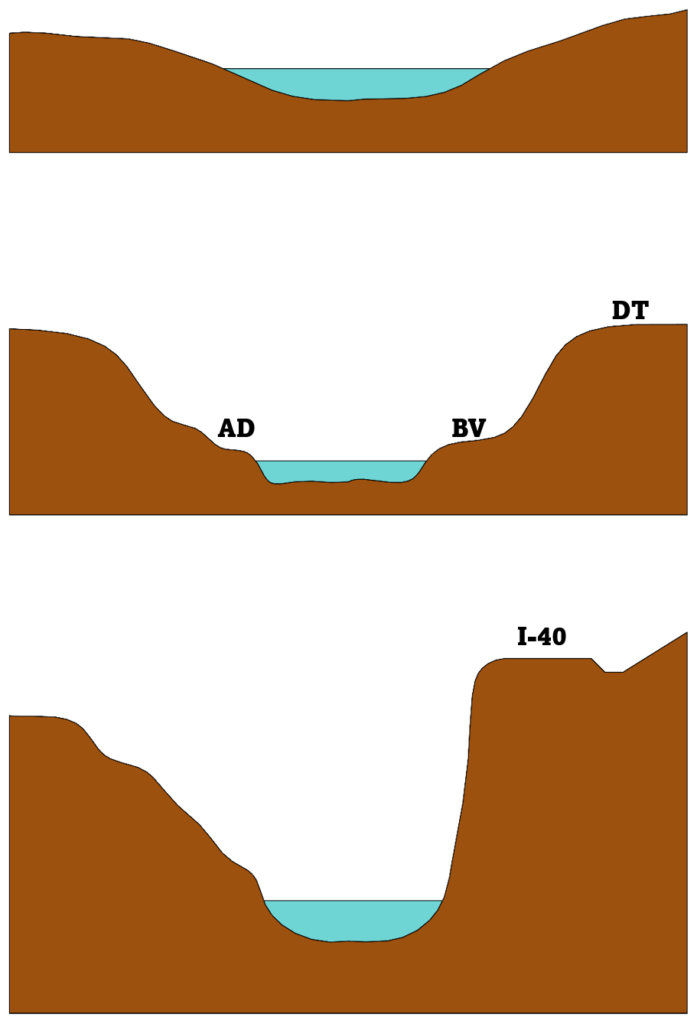
These cross-section diagrams show different stream beds. The top might be through Mississippi farmland in Iowa. As the water level rises the flow area increases quickly, but the water volume is moving more slowly downstream. The middle diagram is an (exaggerated) Asheville, showing Biltmore Village and the arts district in the flood plain, but downtown up on a plateau. Here the flow-versus-depth is quite variable. In another spot we might have an artificial bluff, like the supporting fill of a major highway like Interstate-40 near the Tennessee border. As the water level increases here the flow speed stays elevated, which is how we get the severe scouring that undercut the freeway in several places.
The appropriate cross-sections of a river at a point of interest may not be flat or perpendicular to the mid-stream [1].
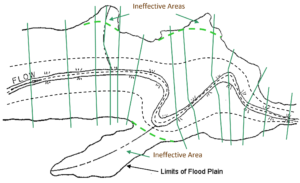
Some diligent mapping (and a measure of educated guesswork) goes into making a usable flow map. All that is to say it’s a lot of work. With all that work done one can begin to record data on water flow versus water depth for a gage location. From there a flood map can begin to be put together along a river.
Here we see such a map along part of the Swannanoa River, through the primary big-box retail district for Asheville.
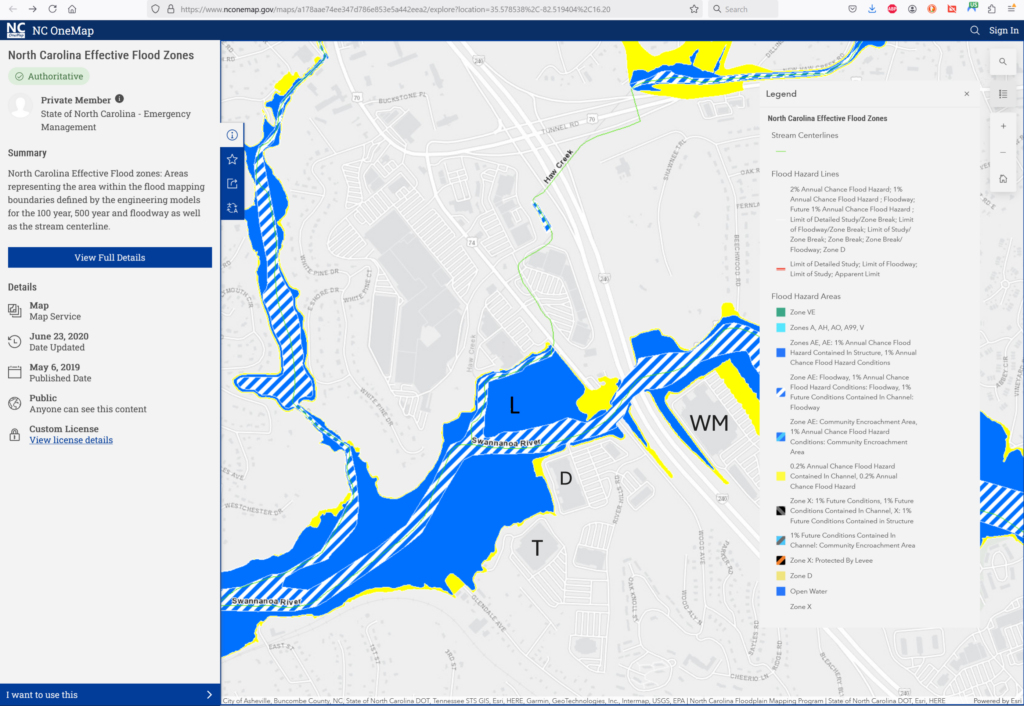
In this official map solid blue is the “100-year” flood zone, yellow the “500-year” zone. Walmart, Lowe’s, Dick’s, and Target, labeled by letter, were all under water up over their front doors in the September, 2024, flood (One may wonder who Lowe’s has for an insurance company…). These retail outlets could have been a big help during storm recovery and clean up, but they were wiped out. Was this really a beyond-500-year event? Let’s look at the data in our simple way.

Plotted here are data for maximum level of the river near this district. Consistent records from a stream gage go back to 1921, and there looks to be reliable information from a famous flood in 1916 so we include that. The new max for 2024 (as of this writing) is 26.1 feet. But the river has been near twenty feet twice in recent years and over 15 another few times[2], so we might suspect that gives us some semi-extreme events to direct a projection of the more extreme.

We put all the annual maximum gage heights in a row again and plot them by assumed equally spaced probability (At the beginning of this project I thought this was a horrible assumption; I see now it’s the most minimal assumption we can make and much better than the assumptions that lead us into more ‘sophisticated’ analysis.) As usual the power law fits better but gives scary big numbers. We have 100-year flood levels of 22.3 or 38 feet, and the 500-year numbers are 28.6 or 78 feet. Again the truth is probably in between the pairs.
Plugging the new 26.1 feet observation into the fitted curve formulas, it would have been predicted as a 43-year or 261-year event. Those numbers are well apart, but both are far under the 500-year mark, which the flood zone map puts at least twelve feet under the actual water level we saw in recent photos.
Correlating back to Rain Fall
We also listed a few comparisons of gage heights and the actual rain event that drove them (the preceding two days of precipitation). If four and a half inches of rain in 2004 got us to over 19 feet at the gage, it shouldn’t be a surprise that almost ten inches of rain could put the gage over 26 feet. We can look at a lot of them and check the correlation.
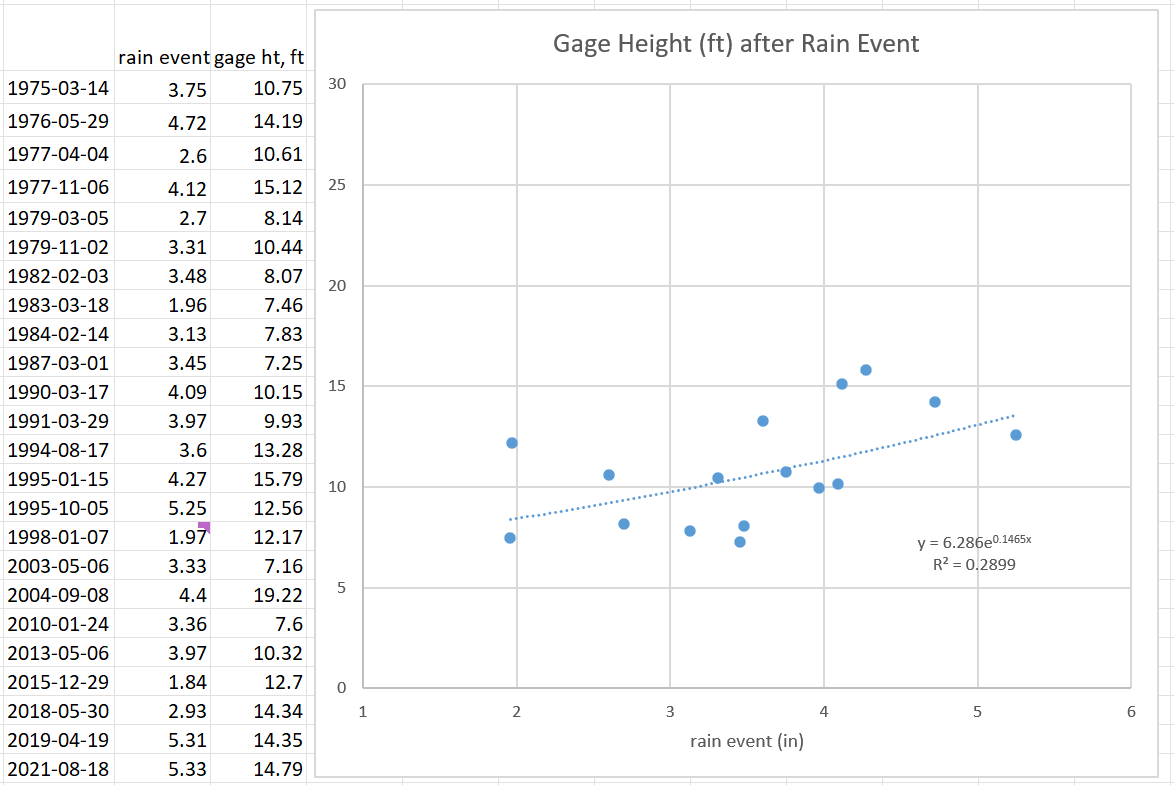
All the events where the gage height got over seven feet, and for which we have precipitation data from AVL, are plotted against the associated two-day rainfall. (Some expected snow melt was added to one of the smaller rain events.) It’s a bit noisy, for all the reasons we explored earlier. A trend line only vaguely fits. But since we have a trendline, what nominal expectations does it give us?
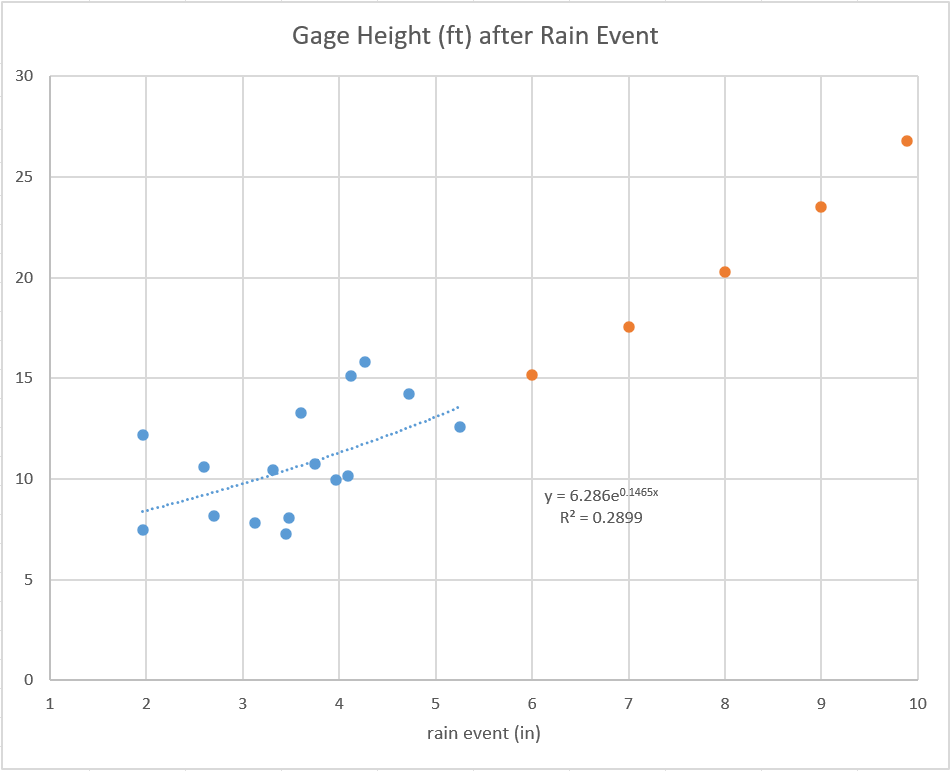
With a humble level of confidence in our loose fit, we expect seven inches of rain should best the previous high-water mark from this set. Also, we project a flood level of 26.8 feet from a 9.89-inch rain event, whisker-close (for a coarse beard) to the true observed value of 26.1.
So how likely was that amount of rain? Going back to our fit of the rain data, we put that 9.89 value into the fitted curves and get a likely average frequency of 46 or 389 years, again somewhat divergent but both well under 500 years.
Comparing the official flood map to the Buncombe County GIS contour map of the area, it appears that the official 100-year flood line is 2015 feet above sea level and the 500-year line is at 2020 feet above sea level [the lines follow so closely one suspects the flood map uses the same 5-foot contours]. The front door of the Walmart is right at 2025 feet elevation, and the front doors were at least five feet into the flood water, for a peak water line over 2030 feet above sea level.
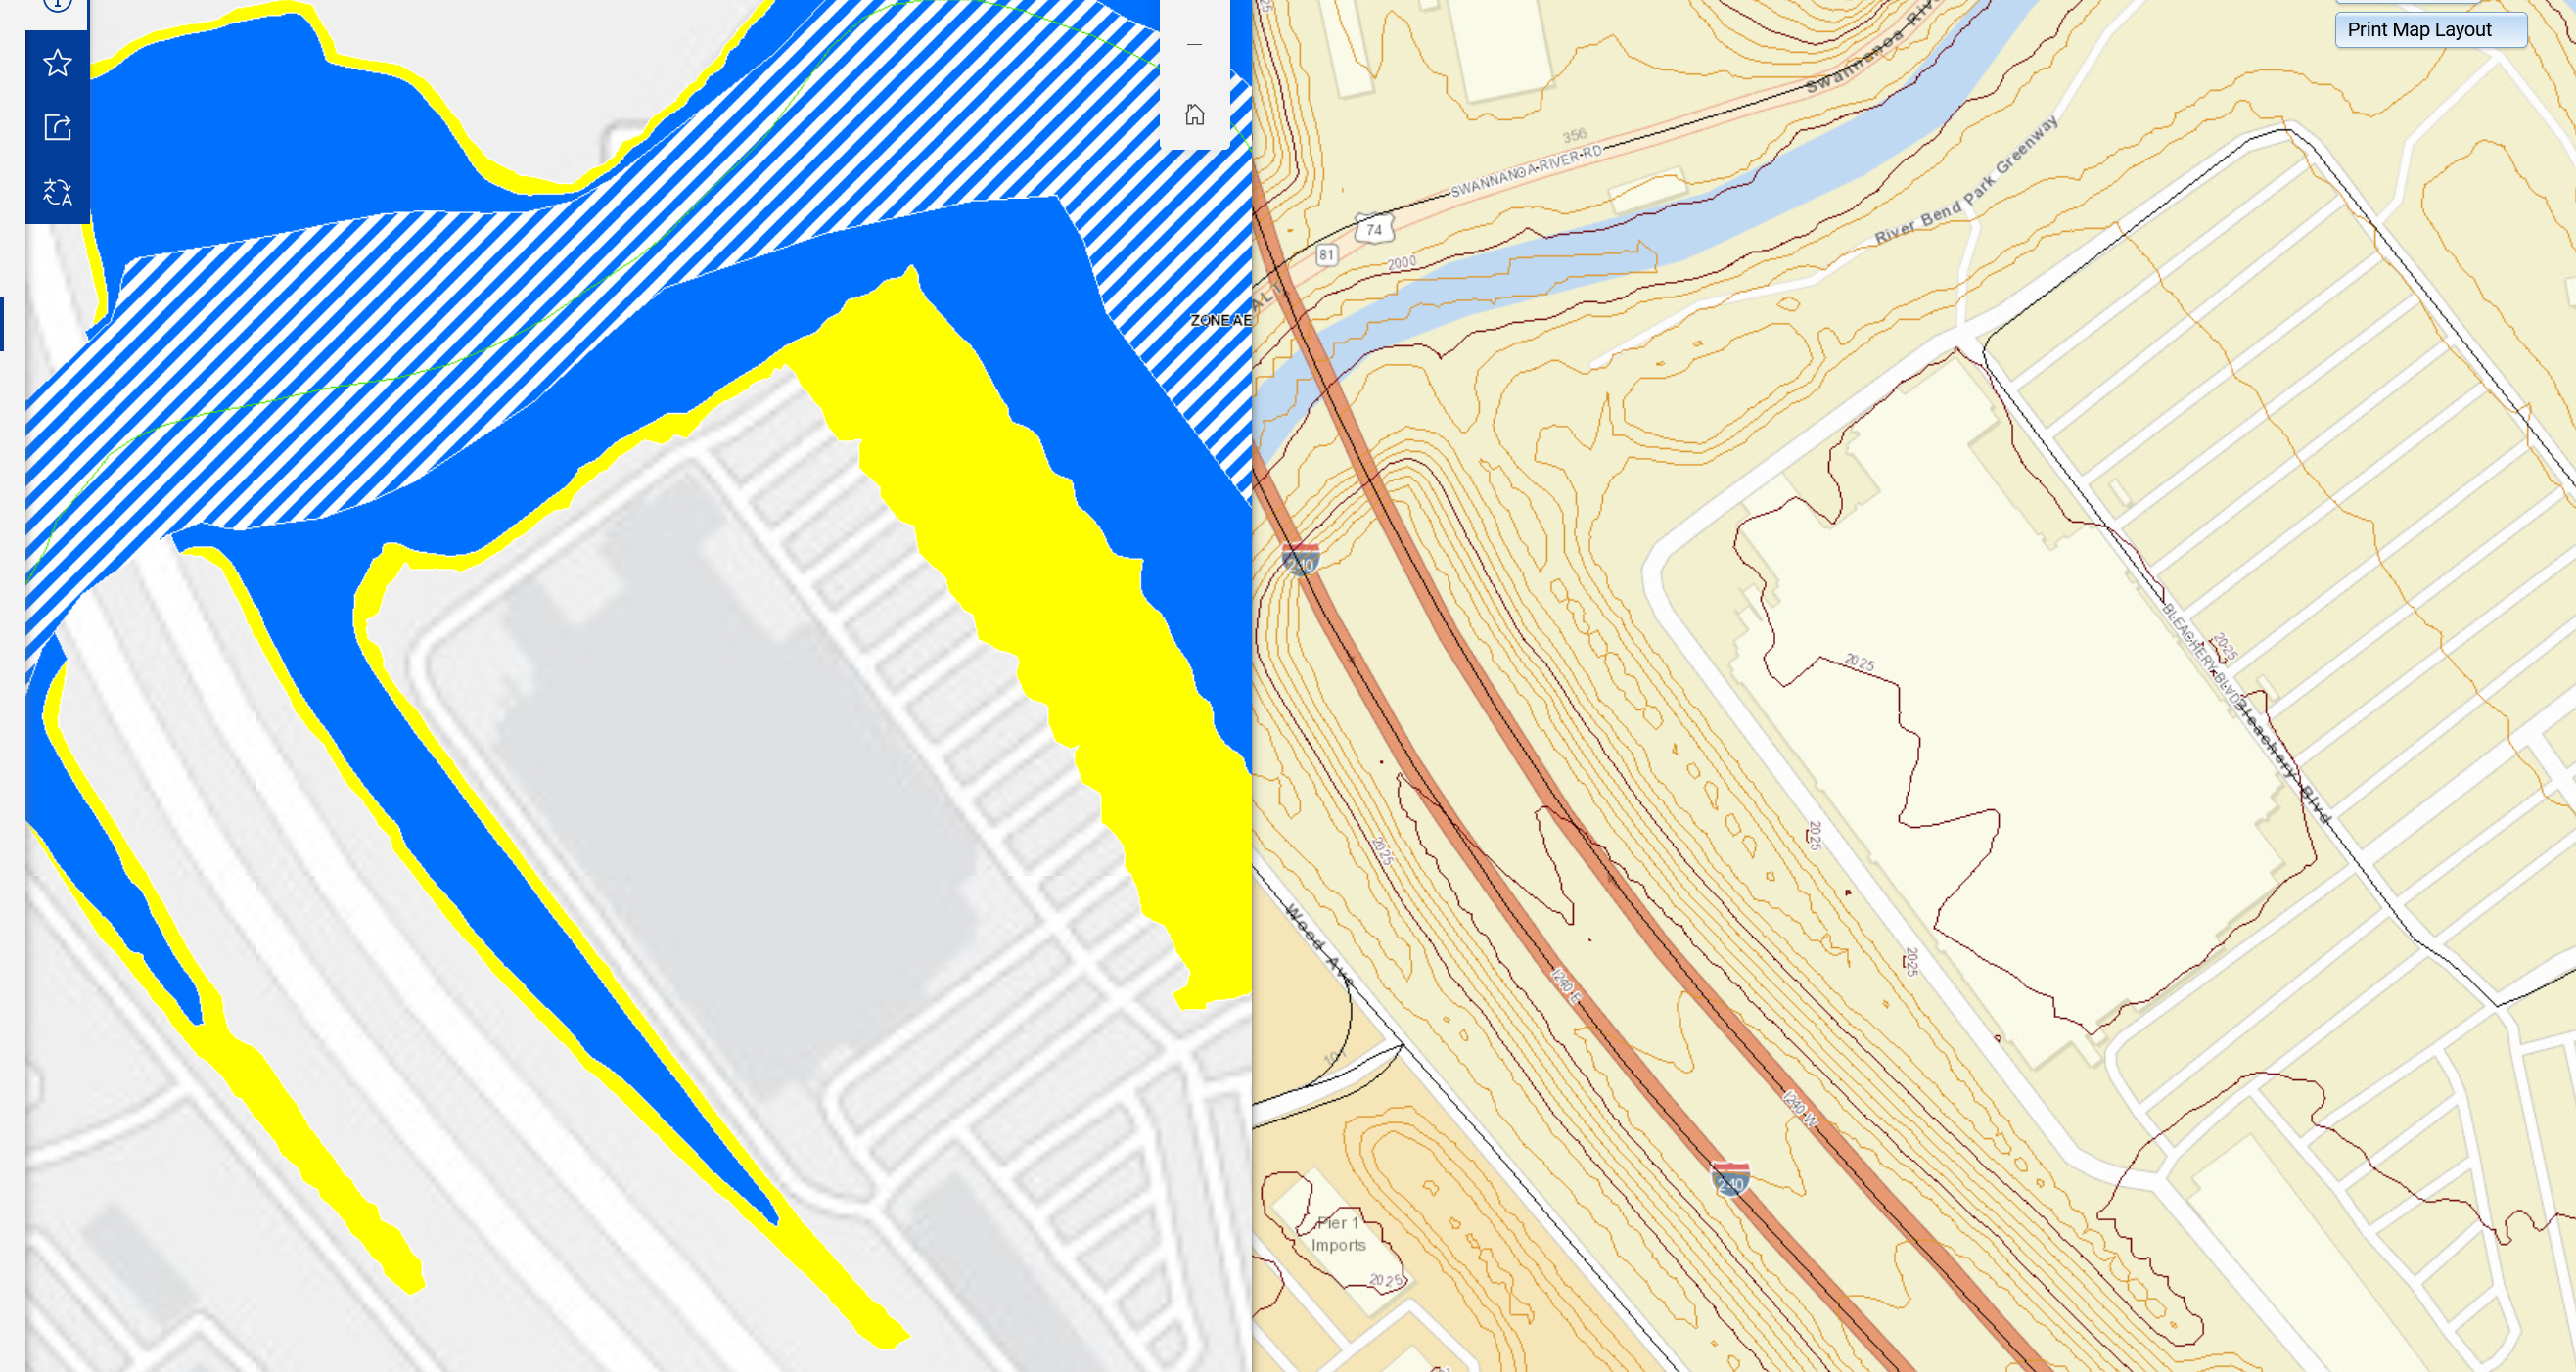
From this we estimate that the official 100- and 500-year flood levels correspond to about 11 and 16 feet on the nearby stream gage. The stream gage has been over that 100-year level 18 times in the last hundred years, and over that 500-year level three times. From our simple fitted function, we would expect these levels to be reached with average frequency of 31 and 66 years.
The analysis here is stubbornly simple, but it is an honest take direct from the data, and it is back-tested in this case by one dead-accurate prediction. We conclude that the official flood maps for the river basin upstream of Asheville, North Carolina, are, to the use technical term, “garbage”.
We should never forget; You Can’t Fool Mother Nature.
There’s no hiding from her
She sees everything
Rules with the iron fist
You know she is the matriarch
https://www.youtube.com/watch?v=fs8RUFS18g0
[Unleash the Archers – The Matriarch]
[1] US Army Corps of Engineers Hydrologic Engineering Center, HEC-RAS Hydraulic Reference Manual, https://www.hec.usace.army.mil/confluence/rasdocs/ras1dtechref/6.3/basic-data-requirements/geometric-data/cross-section-geometry
[2] Victoria A. Ifatusin, (October 4, 2024), “It’s official: Helene’s rainfall, flooding broke all-time records”, https://avlwatchdog.org/its-official-helenes-rainfall-flooding-broke-all-time-records/
Next part: https://www.scienceisjunk.com/the-100-year-flood-a-skeptical-inquiry-part-6-of-six-for-now/
Previous part: https://www.scienceisjunk.com/the-100-year-flood-a-skeptical-inquiry-part-4/
[…] The “100-year Flood”, A Skeptical Inquiry, part 3 The “100-year Flood”, A Skeptical Inquiry, part 5 […]
[…] The “100-year Flood”, A Skeptical Inquiry, part 5 […]