Part Three – An Enormous Data Set (and small bites of it)
[The entire report can be downloaded as PDF, flood_years-r0-20241201.pdf]
[The start: https://www.scienceisjunk.com/the-100-year-flood-a-skeptical-inquiry-part-1/]
We’ve come to the question of how well or badly we can make estimations of future severe weather events from limited data. One fun way to find out is a Monte Carlo simulation (this is only fun when one has a fast computer). We will try to make a very long, practically infinite, string of fake weather history then sample it many times (randomly or exhaustively) and see how likely we would be to observe the most severe events in different situations.
Starting From Short-Term Real Data (again)
The first attempt at a Monte Carlo study will use the Clemson-Oconee data. Its 23 years of good data is about average in length for stations in the U.S, as we saw earlier.
First all the data for total precipitation (two-day events) is loaded into our program.
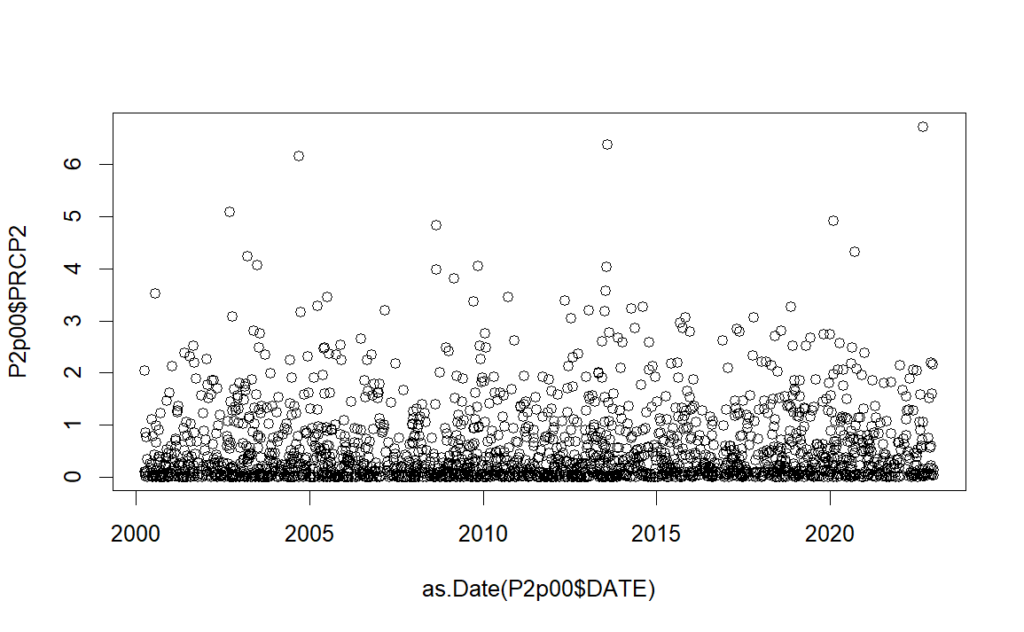
There are an awful lot of zero values, a majority in fact. Right away the positive values are split off and we drop the dry days. The days which had positive precipitation can be put into a histogram that looks like this. (This histogram is normalized to have a total area of 1.0, making it usable as a piecewise probability distribution.)
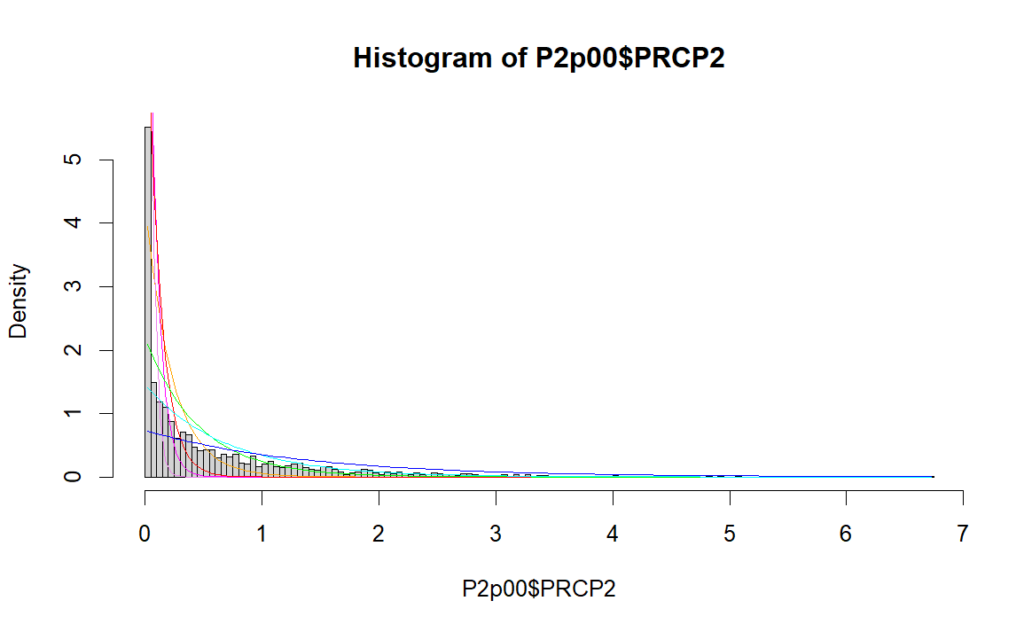
There are still an awful lot of days with just trace amounts of rain. The colored lines are attempts to fit “exponential distributions” to the data. The exponential is appreciated for being simple mathematically and tending to look a lot like plots of real events that have diminishing frequency related to the magnitude of the event. Using the exponential is the only good assumption we’re going to make today.
But in this case trying to fit a single exponential to the whole set doesn’t look very good. In the real world we expect that weather events are related to specific conditions, like a cold front moving through from Canada, or a warm damp air mass coming from the Gulf of Mexico, or a collision of the two. Each of those conditions might have a distribution of resulting weather effects like precipitation. The combination would have another, probably more severe, distribution. Every other notable atmospheric condition, and all their combinations, might have different distributions, and each of those conditions has a likelihood of being present in the first place. A single smooth curve may not fit the sum of all those situations.
Data Fitting by Block
For purposes of this study, we’re going to break up the data by amount of rainfall, assuming that ranges of rainfall correspond broadly to the different conditions (I did say our last good assumption was behind us).

This graph shows the frequency of all rain events that exceeded 0.2 inches, by the amount of exceedance. Now a single exponential curve fits much better. The best fit, the orange line, has an error 91% lower than in the first graph, according to one standard measure.
The same thing is done for exceedances over 0.2, 0.4, 0.8, 1.6, and 3.2 inches of precipitation (in two days). Data does get a bit sparse by 3.2.

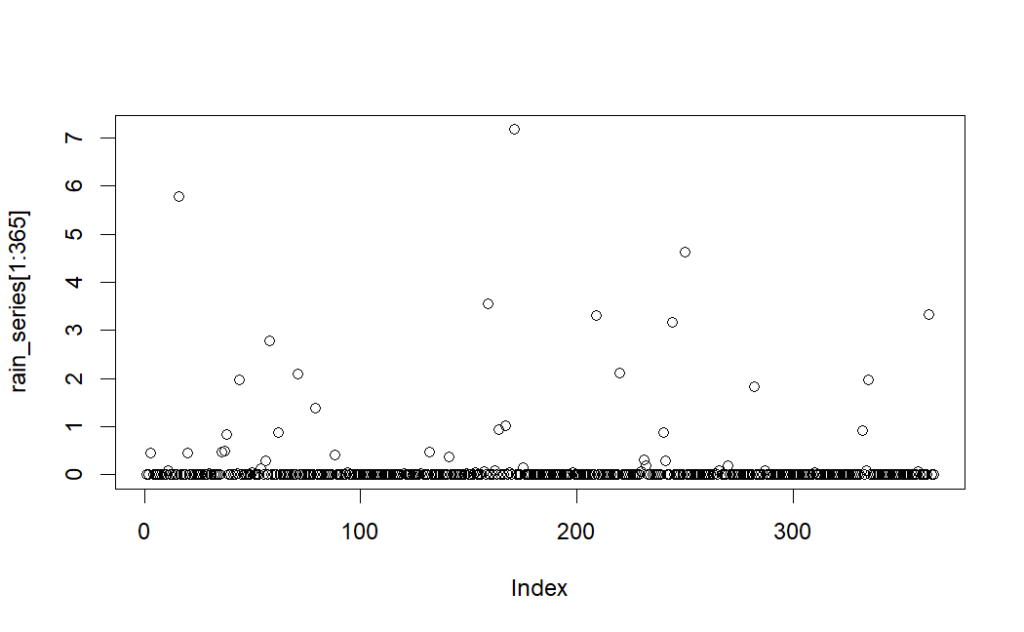
The trick then is to add the six distributions together to get one “reasonable” bundle that we can use to make a very long realistic synthetic history. We know how many days in the real data had no rain, over 0.2 inches of rain, over 0.4”, etc. Weighted samples of each distribution are taken roughly by those frequencies. Some tweaking is done to get the annual total rainfall to match history and for the total distributions to be comparable. One year of fake data looks like this,
The real and made-up distributions are compared.

Each gives an average annual rainfall of about 47 inches. The fake distribution is a bit lumpy, which is no surprise since the contributing functions overlap. No attempt was made to fit these together smoothly. Other defects in the fake data include lack of seasonality and effective independence of all the data. But here our interest is in the extreme events, not the mundane.
The simulation distribution may be juiced a wee bit to give a better chance at big values. This allows for better illumination of how good or bad a short sample can be. Remember that we only have about 23 years of data, out of thousands of possible years. The point of this Monte Carlo study is to test the likelihood of a relatively small sample revealing the true distribution of severe events.
The new distribution is used to randomly generate daily data for 20736 years (124), over 7.5 million days. The daily draws are independent, but the distribution is made from two-day data already, so the simple one-step influence (rain today is correlated with rain tomorrow) is baked in.
Checking Every Possible Subsample
Now we’re going to pretend that we only have a 23-year long window of observations into that long history. There’s no telling where in the timeline our particular sample starts. With all the rain data stored, the maximum of each 365-day block is saved into a list. Every possible 23-year set (year 1-22, year 2-23, year 3-24, etc.) is checked for its observed maximum and that list of 20714 maximums is charted in a histogram below.
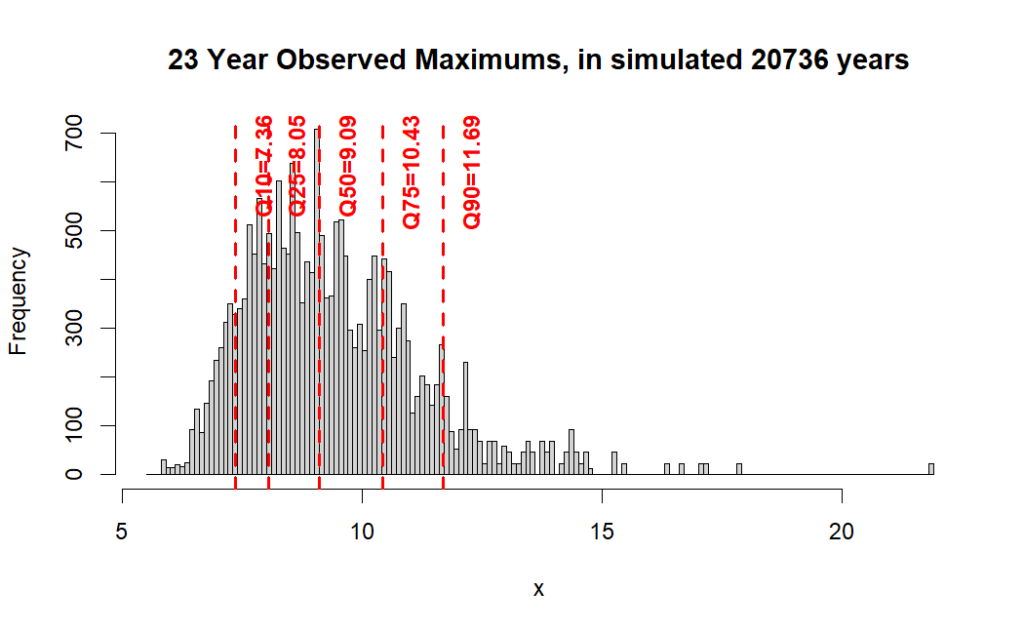
In all those possible short histories, we have even odds of observing nine inches of rain and 75% of the time we would observe annual maximum rainfall of under 10.43”. Rainfall in excess of that was found 252 times in our simulated long history, with a maximum of 21.8”. Some of the possible histories could hint at severe possibilities, but many will fall well short.
This particular Monte Carlo simulation gave a single outlier of 21.8 inches of rain. The series could be generated again many times (as it was) and not make another data point like that. Still, it reinforces the point that the best we can ever do is come up with an odds-of-exceedance beyond some semi-extreme value. The true extreme of a scalable event knows no bounds short of the limits of the entire system. In this case that would be every molecule of the atmosphere conspiring at once to reinforce a storm in one spot!
So, what if we have a lot more data? Let’s try that long Ft. Bidwell set. It’s a much drier location, with about 17.6 inches of rain per year. We fit data to each exceedance range as before.
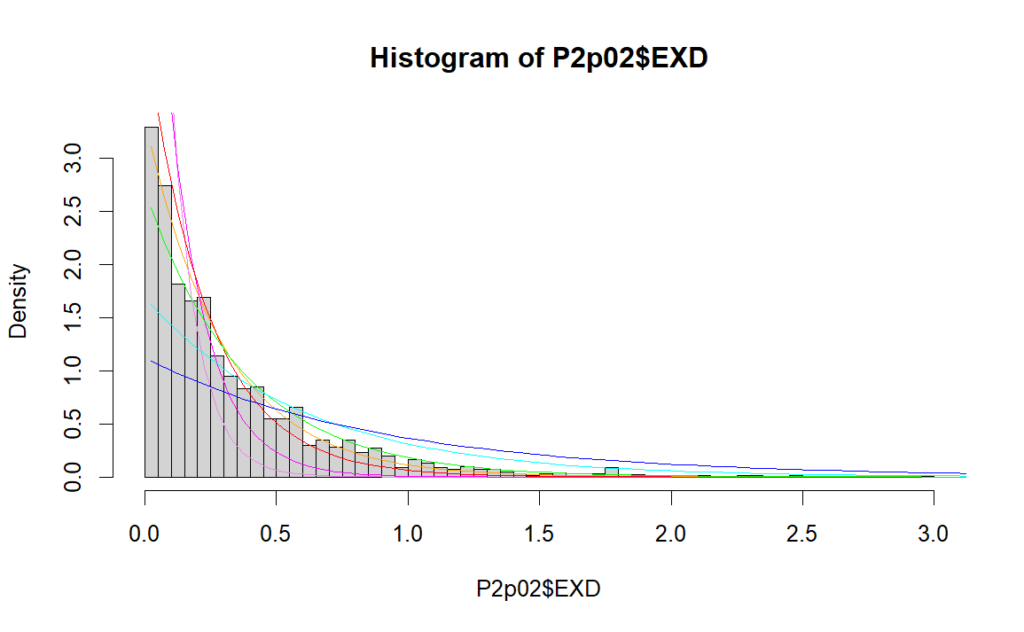
It’s still difficult to fit exponentials which catch the large bunches near zero but also allow enough events in the mid-range or higher values.
With more fitting and fiddling we get a distribution for simulation that gives a similar looking graph and about the same annual rain fall (17.3” simulated vs 17.6” historical).

One sample year of precipitation looks like this,

Again, a very long series is simulated, 20736 years. If we had the same 128 years to sample this long history at every possible starting year, our maximum observations would plot like this.

Sampling 128 years at a time there’s a 75% chance that we will never see a maximum rainfall event over 6.54 inches of water. Such an event happened 49 times in the long history, with a maximum of 10.15”. That’s a 55% difference, and a big absolute jump for a dry place.
How much worse would it be if we only had, say, 25 years of data?
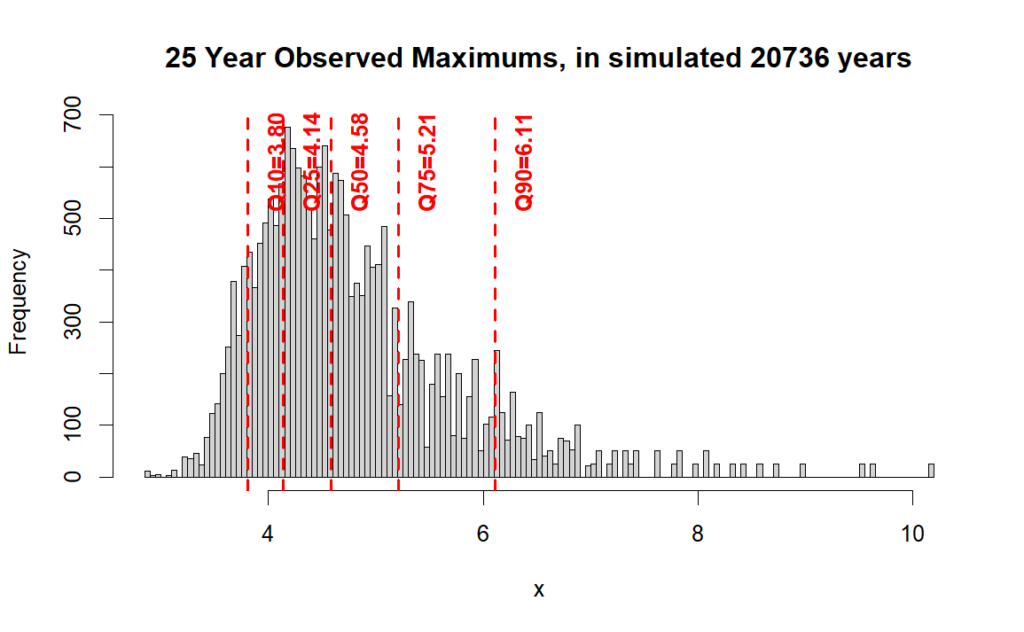
Now the 75% line is at 5.21 inches, which is less than 243 rain events in the long history. Compared to the same overall maximum, it’s now a 95% jump!
If we do this for 15, 25, 50, 75, 100 and the full 128-year sample sizes, we can tabulate the quantiles and graph them together.

As expected, the likelihood of finding an extreme value increases when we take a longer sample, and it’s not quite linear. There’s less payoff to adding more years the more years we have, and at the other end having fewer years things get bad faster. We see now how the selected “lucky” and “unlucky” periods in the previous section had such different 100-year event predictions. The prediction is sensitive to the last few maximum values, and they don’t come by very often.
It should be noted that this synthetic sample probably gives milder results than a true long-term weather series would give, for a few reasons.
– The data are truly independent (as well as a computer random number generator can make them), limiting clustering as might be seen in periods of drought or prolonged wetness.
– There is no seasonality, which would lead to smaller scale clustering.
– The data is “stationary”, with no long-term trend. Long term climate shifts are a matter of record, and at this epoch in history increasing weather volatility is expected pretty much everywhere.
So far, we’ve tried generating 100-year event numbers in a simple way on short data sets and then experimented with a very large but very made-up data set. As a last step we’ll look at results from a more sophisticated analysis method (and then try to break it).
Next part: https://www.scienceisjunk.com/the-100-year-flood-a-skeptical-inquiry-part-4/
Previous part: https://www.scienceisjunk.com/the-100-year-flood-a-skeptical-inquiry-part-2/
