Part Two – Sampling the Longest Available Data Set
[The entire report can be downloaded as PDF, flood_years-r0-20241201.pdf]
[The start: https://www.scienceisjunk.com/the-100-year-flood-a-skeptical-inquiry-part-1/]
Looking for information about rare events, we naturally gravitate toward records with a long history. In this section we try to generate some statistics and projections about extreme rain events from a large sample of data. In the Global Historical Climate Network daily database, the largest record for the United States is that for Fort Bidwell, California
Holey Data
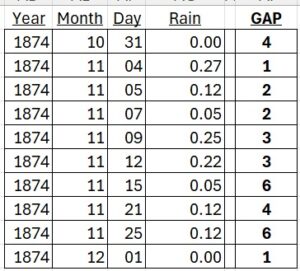
The data set on offer for this location promises data all the way back to June of 1867. Sticking to whole years we take 1868 through 2023. Great! For this 156-year data set we should get 56,979 days of observations. But there are 46768 observations available in the file. Where are the other ten thousand days? We mentioned before about long gaps in data sets. The range from October, 1893, through mid-May, 1911, simply isn’t there at all (6438 days). But small gaps are scattered throughout as well, many apparently in the middle of long weather events.

There are 451 other gaps in the set, mostly single days but up to a six-month gap, making up the other 3770 missing data points.
Gaps in the data are not a huge impediment to finding the peak values; we still have a pretty large sample of days. But we are going to look at 48-hour totals, and many of these gaps were in the middle of stormy periods, so those two-day sums are gone. This means we lose some chances to catch extreme values, and the missing pairs will affect the fitted curves we’re going to generate to simulate super-long data sets.

In the past I have had to deal with many unexplained holes in weather data. Sometimes a station is un-manned or out of commission because of severe weather, an obvious drawback in extreme-weather event analysis. In October of 1945 Typhoon Louise swept across Okinawa, ripping through the camps and piers of what was to have been the invasion force of mainland Japan. Official wind speed on the first day was recorded at 130 mph – only because that was the limit of the local instrument. The next many days were not recorded because the instrument tower was destroyed by even faster winds. [The storm was also completely unpredicted. “They knew a typhoon was running through to the south of us. But for no reason, perhaps the whim of a bored Greek god, it stopped and turned north, growing stronger by the hour as it was nudged along by that neglected ancient immortal.” – X-Day Japan [1]]
Older data, while valuable, has its own problems. Differences in methodology and instrumentation may not be documented. At a glance one might be skeptical of the precision of rain amounts from the 1860s recorded at Fort Bidwell as exactly 2, 3, or 5 inches (which is only seen after converting back from the archive’s tenths-of-millimeter). In the same year we see records of 2.10, 3.05, and 5.12, so something was possibly amiss on those other days.
The GHCNd database is full of flags noting where data has been estimated or assumed from other sources. Those methods may be “reasonable”, but they still introduce further uncertainty and noise in the data which may properly erode confidence in resulting statements
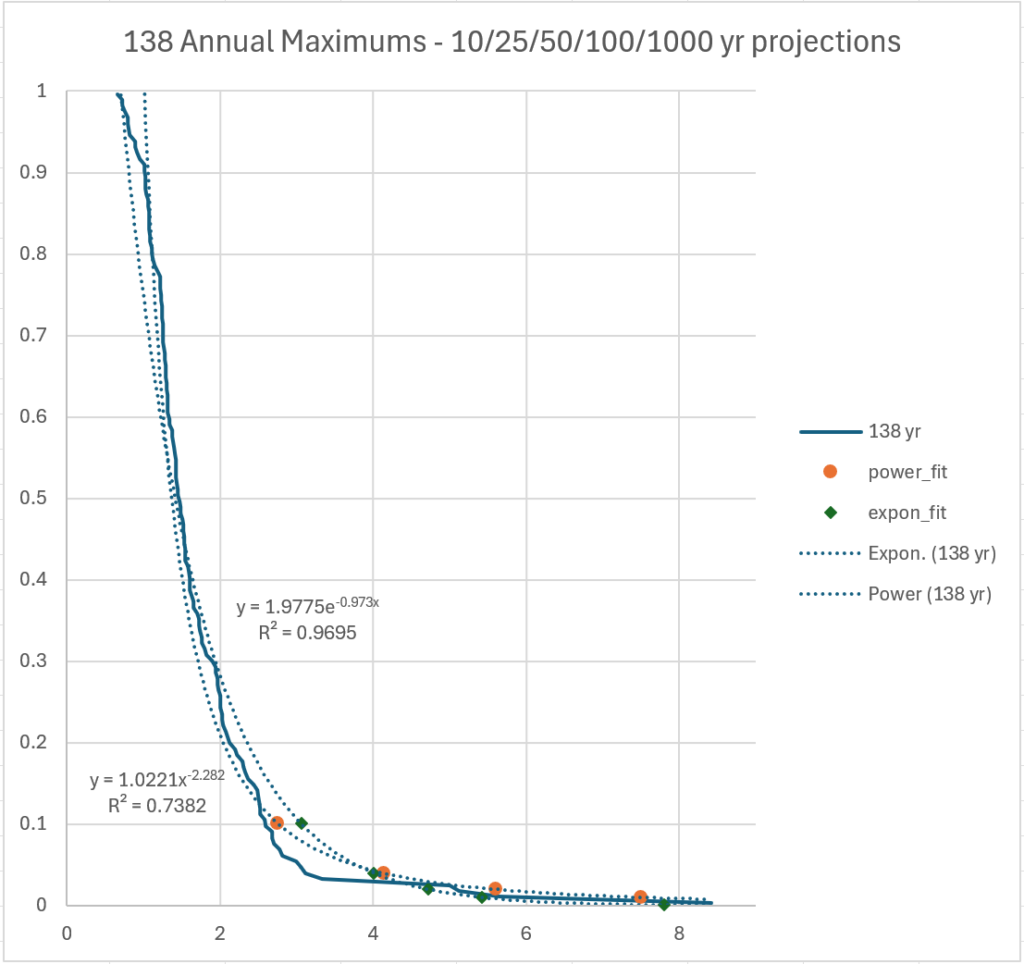
But taking what we have, we do curve fits like before on annual maxima for the entire long data set.

It’s no surprise that the 100-year projections, about 5.5 and 7.5 inches, lie inside the real data set, which is a good bit longer than 100 years.
Different Previews of the Big Show
But this gives us a chance to experiment. What if this was a location for which we had less data, like at most other stations? We could be trying to do our estimations at any time in history. So, we will look at a couple different 25-year-long samples.
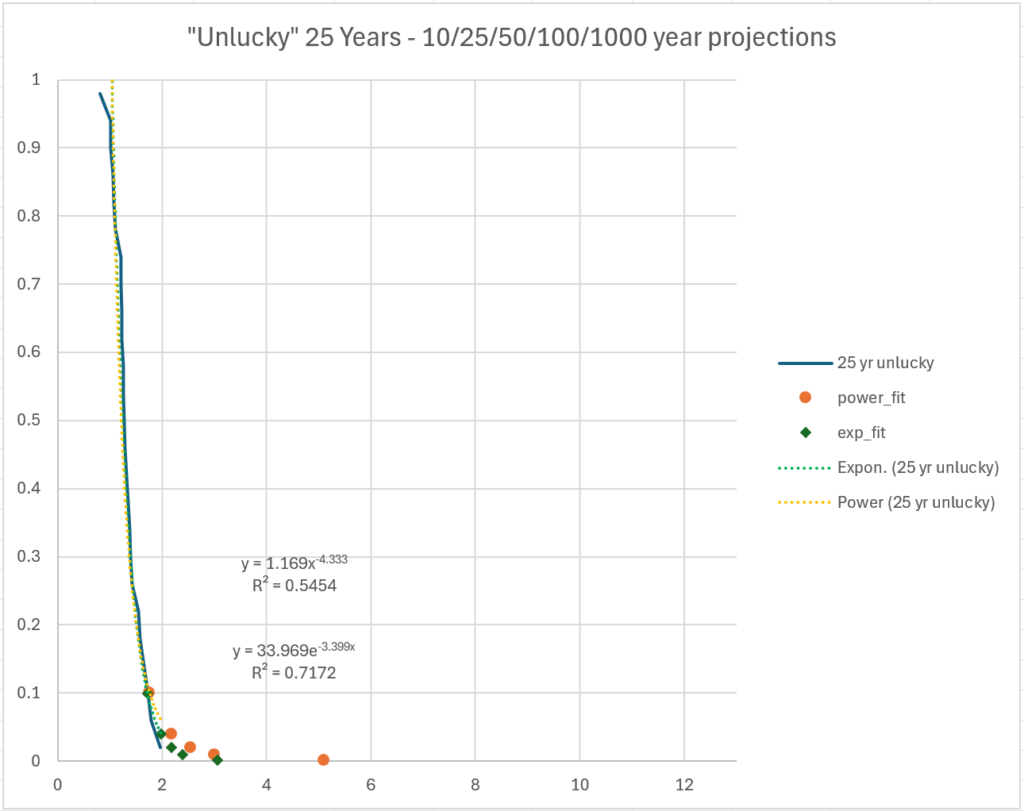
If we start in 1911, for writing an insurance policy for someone lucky enough to afford a home during the Great Depression, there are very few large rain events to use.

Extrapolating from this short history we get hundred-year events under three inches and even the thousand-year event predictions are in the low single digits.
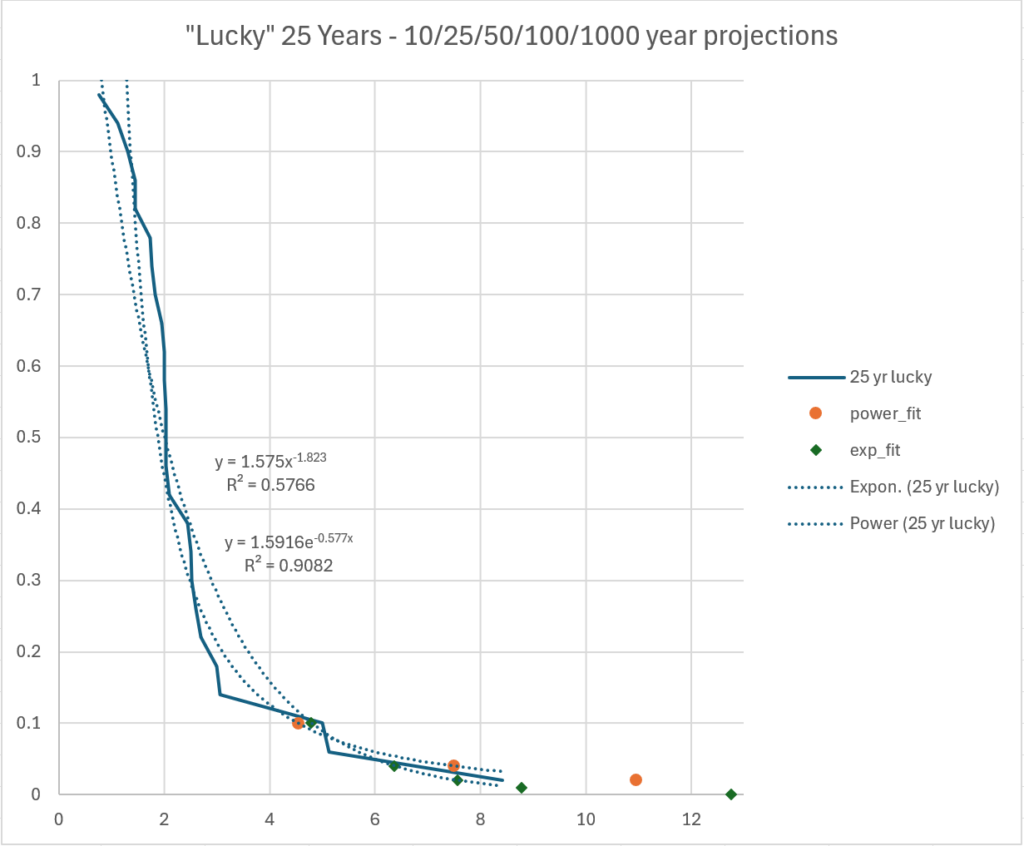
If we start back at the beginning in 1868, because we want to build near a river in 1893, we get a very different graph.

The 100-year event in the former case is under 3 inches of rain. In the latter “lucky” case, the 100-year event is 16 inches of rain (both from the power laws, which had better fit).
Using a weather history with 128 years of observations was certainly better than using the 23-year set. But as noted very few weather stations have data going back that far. Can we say something about the certainty of our calculations when there is a limited number of years of data to use? We will try in the next section.

[1] Keylor, Howard, “Surviving Typhoon Louise”, http://danielborgstrom.blogspot.com/2012/08/surviving-typhoon-louise.html
Next part: https://www.scienceisjunk.com/the-100-year-flood-a-skeptical-inquiry-part-3/
Previous part: https://www.scienceisjunk.com/the-100-year-flood-a-skeptical-inquiry-part-1/
[…] The “100-year Flood”, A Skeptical Inquiry, part 2 The “100-year Flood”, A Skeptical Inquiry, part 4 […]