Part One – Are the 100-Year Flood Maps We Use Any Good?
[The entire report can be downloaded as PDF, flood_years-r0-20241201.pdf]
Anyone who has tried to buy a house has probably seen a form somewhere in the closing packet certifying that the structure does not lie in a “flood plain”. Or if any part of the house is in the flood plain there will be extra paperwork (and a big check) for flood insurance. Someone at the insurance company has to work out a competitive premium to charge for the insurance. Someone else already worked out the map that defined the flood plain. How did they do it, and how sure are they? If they’re wrong many more houses than expected get destroyed and insurance companies go bankrupt, or insurance rates are sky high and whole towns get abandoned.
History suggests that Mother Nature takes some delight in proving people wrong in these projections.
Challenges
Official flood plain maps usually are attempts to plot the limits of a “100-year flood”, or an event with a 1% chance of happening next year. For other purposes one might want to know about a less- or more-rare event, e.g. the 1000-year event for “worst case” planning around something of critical importance. To estimate these probabilities, one might lean on historical weather data.
This has a number of problems,
– Rare events don’t show up in data very often, by definition,
– Extrapolations beyond history are hyper-sensitive to sparsity and noise in the data,
– The available data is (much) worse than you probably expect,
– The assumptions made in statistically modeling weather are wrong,
– Translating weather data into real effects, i.e. local flood level, is messy,
– People easily forget all the above when citing statistical predictions.
Rare and extreme events by nature are difficult to handle statistically. They sit largely outside limited historical data. Functions fitted to that data are burdened by a large number of mild events and can be highly sensitive to the values of the few semi-extreme observations. Attempts to build math- and/or physics-based models of weather at the extremes will similarly run into hyper-sensitivities to small changes in debatable parameters.
The only thing that history shows us for sure is one example of what was “not impossible” at a previous point in time. To get anything else from that bit of information requires some assumptions, which in the context of other information and knowledge may be reasonable. To make claims based on a series of events over a span of time usually means making additional assumptions, most of which are convenient but untrue (more on this in later parts).
We’re going to try some simple modeling techniques to demonstrate the challenges. We’re going to get some real data, then we’ll make up some big batches of fake data to mine.
The first job is to get the real data. This project is partly spurred on by hurricane Helene charging up into the Appalachians, wiping out some towns with raging flood waters and putting large parts of Asheville, North Carolina, under ten feet of water. At the start of the project naturally it was desired to get a bunch of historical weather data. But the NCEI (National Centers for Environmental Information) and its GHCNd (Global Historical Climatology Network daily) database are housed in Asheville…

This was not a good start to a project which took this author much more time than expected (another lesson in prediction error!). The first analyses here used data from near Clemson, SC, which was already in hand.
Rain Amount Is Not Flood Level
Weather data, like precipitation, is somewhat easy to get, but it’s not exactly what we want for flood prediction. The effects of total rain fall are greatly dependent on local geography. When a river crests, it’s getting flow from everywhere up stream, so we really want to know how much water fell into the entire upstream basin.
Stream level history may be better for direct estimation of flood events, but rainfall is directly related, and such data is more widely and deeply available. We’re going to focus on precipitation data, using daily totals. Snow totals will be converted at 0.1 inch-per-inch, and we’ll stick to temperate locations where snow does not often accumulate for long.
Flooding is very time-and-order sensitive. A long all-day soak followed by a sudden heavy burst is a great recipe for flash floods. The reverse order isn’t as bad. And what if there is rain two days in a row? If many inches of water came spread out or in separate showers over the two days that’s a low-impact event compared to three inches just before midnight then another four before one am.
For this analysis were going to sum pairs of adjacent daily rain totals. When there are many days in a row of rain, considered one long weather event, the days are paired, even or odd as counted in the event, such as to give the largest max for the event.

These max pairs are used here as a surrogate for true flood level data. Total 48-hour rain is presumed to be a useful marker for flood potential.
Toward the end of this article we will work on connecting flood levels and rainfall.
Lousy Data, But Lots of It
That 3.26-inch rain total in Clemson? That’s more than either the 1.94 and 1.32 that make it up, but it’s still badly wrong. I personally recall rain falling for 15 days in a row in that month. A contemporary news account relays that, “According to the National Weather Service, Seneca received 6.91 inches of rain between midday Saturday and midday Sunday.[1]” (Seneca is the actual locality of the Clemson-Oconee County airport.)
That mismatch is on a very modern bit of data. Going back farther through other data sets I’ve not compared archive data to contemporary reports too many times. A deep survey would be required to cross-validate the available mass of weather data.
The complete GHCNd database (as of the end of October, 2024) extracts to a 32-gigabyte archive file. The list of stations alone is almost 11 megabytes. This is a lot of data in total, but few of the streams are long and continuous and of high quality. In the United States alone 48,415 stations are listed. But about 7,000 of them have less than a year of data. The average range of dates covered is almost 22 years, and over 4000 of them span 75 years or more, but most of the longer sets are discontinuous. The longest data set with modern reports goes back to 1840, from Carlisle, Pennsylvania. But that station has no reports from the 1880s through the 2000s, and one wonders about the compatibility of data collected almost two centuries ago with the modern block.
The problem remains, how do we make projections from a limited pool of recent high-quality data?
First Predictions
We will start with a very simple way to extrapolate from a set of rainfall data directly into those 10/100/1000-year rain event numbers[2]. Data was in hand for the Clemson-Oconee County Regional Airport. This location is near where the author lives, and the data was used in a mathematics course at Clemson University. It’s a relatively new airport, and even newer official weather station. 23 continuous calendar years of daily data are available for this station.
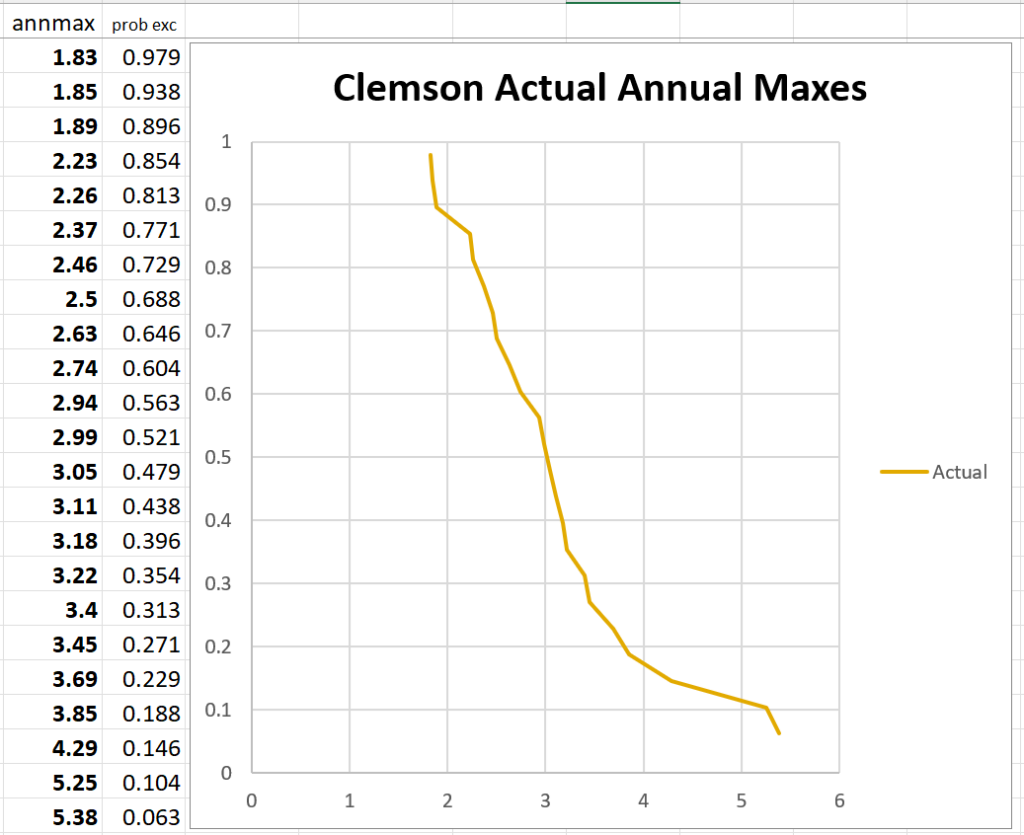
For this station the annual maximum (2-day sum) precipitation totals are found. Those maximums are put into a list and sorted by size. Then we begin making wild-but-useful assumptions!
If we assume the data are a perfectly representative sample of all possible maximums (very optimistic), and that the values are independent of each other (false), and that the probabilities don’t change over time (false), then the chance of any new year maximum falling between any two of the 23 known values is about 1-in-24. Another half of a 24th of probability lives above and below the highest and lowest values. The probability values can be plotted against the rainfall amounts and we get a graph as follows. The form is a type of “waterfall chart”.

While based on a list of assumptions we know aren’t true, these plots do usually, so far as I’ve seen, make a pretty reasonable curve. We can fit the right sort of simple function to them and get a visibly acceptable fit. Then that function can be used to extrapolate to more distant probabilities – those one-in-a-hundred and one-in-a-thousand rare events.

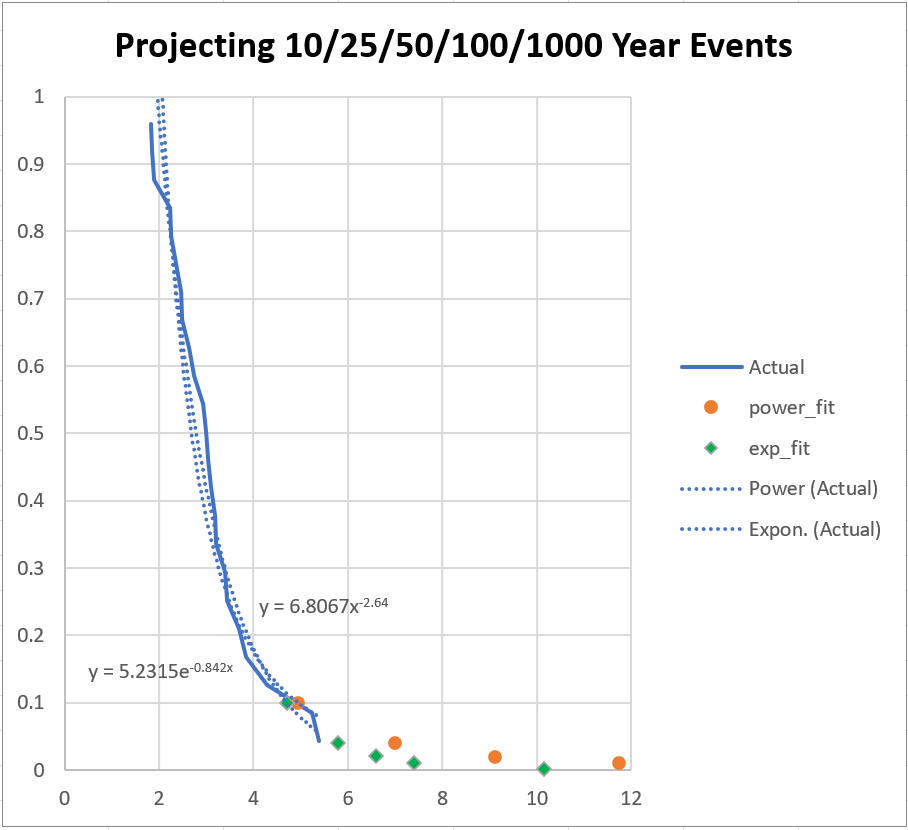
Here we have two different functions fit to the real data. One is a power-law format, the other is an exponential[3]. Both fits “look” good, and neither varies much from the other in the range of the actual data. But these sorts of ‘scalable’ functions are very dynamic at extremes, very sensitive to those last few semi-extreme data points.
Both give a 10-year (probability 0.1) maximum likely rain amount of just under five inches. But the 100-year values are almost twelve inches from the power law versus 7.4 inches out of the exponential. Trying to get a 1000-year event (from 23 years of data) the projections spread from 28 to 10 inches of rain.
This example demonstrates the difficulty in getting long-range projection from short-range data.
But what if we had a significantly longer data set? In the next part we will try to use the longest available data set in the US archive.

[1] Hardesty, Abe, (August 13, 2014), Clemson Campus Slowly Recovering from Deluge, Anderson Independent Mail
[2] Soltys, Mike, (September 14, 2013), “How to calculate the 100-year flood”, https://www.mikesoltys.com/2013/09/14/how-to-calculate-the-100-year-flood/
[3] What we specifically want to fit is a monotonic decreasing function with a zero asymptote, preferably which can be scaled to an integral area of one, but such is not necessary at this stage.
Next part: https://www.scienceisjunk.com/the-100-year-flood-a-skeptical-inquiry-part-2/
[…] The “100-year Flood”, A Skeptical Inquiry, part 1 The “100-year Flood”, A Skeptical Inquiry, part 3 […]
[…] part: https://www.scienceisjunk.com/the-100-year-flood-a-skeptical-inquiry-part-5/ Back to the beginning: […]
[…] [The entire report can be downloaded as PDF, flood_years-r0-20241201.pdf] [The start: https://www.scienceisjunk.com/the-100-year-flood-a-skeptical-inquiry-part-1/%5D […]